

Pointsman processes requests through authentication, model authorization, budgets, guardrails, caching, routing and durable usage accounting. Latency depends on the path: an exact cache hit avoids provider dispatch and semantic embedding, a semantic miss performs cache lookup before forwarding, and an explicit cache bypass skips cache lookup. This page reports those paths separately and explains the work measured by each stage.
Use the path that matches your application, and keep three measurements separate:
| Measurement | What it answers | What it does not answer |
|---|---|---|
| Client-observed response latency | How long until this complete response arrives? | How much time belongs only to the gateway? |
| Gateway versus direct-provider distribution | How do two otherwise comparable test paths differ? | The p99 of added time for each individual request |
| A named stage timer | How long was that instrumented operation active? | An exclusive fraction of total request time |
For streaming, time to first token and time to completion are separate measurements. A slow reader can increase completion time without increasing time to first token. The short synchronous benchmark below measures neither streaming TTFT nor real-provider generation time.
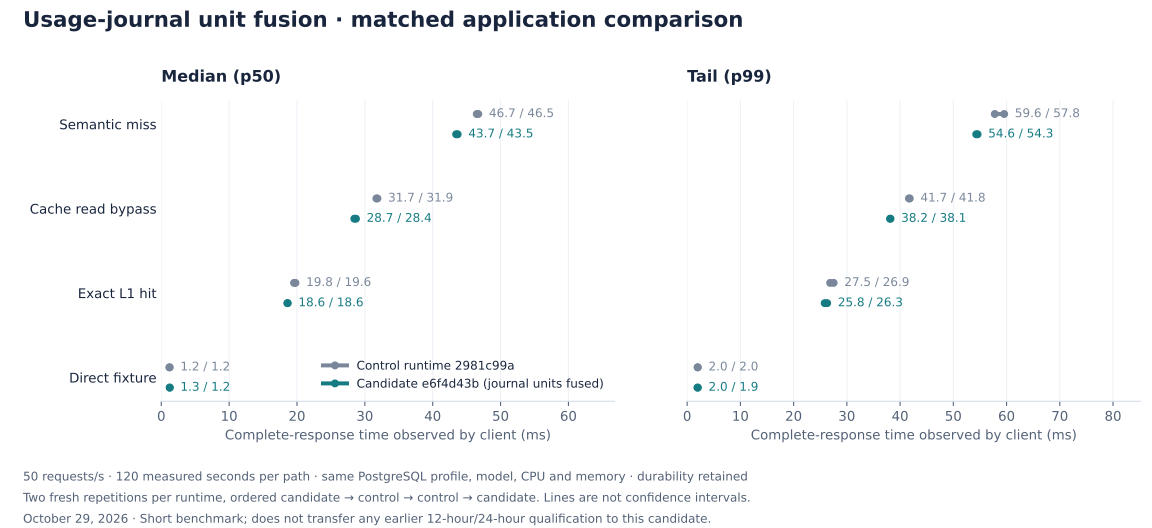
Usage-journal unit fusion comparison#
29 October 2026: candidate runtime c8de5d86 against the optimized runtime
2981c99a, same PostgreSQL profile, model, CPU and memory in all four runs.
The candidate changes one thing: how often the durable usage journal fsyncs its
directory. Each request used to force the journal directory seven times (after
each of four record renames and after each of three unlinks). The candidate performs
a record write and the unlink of the record it replaces as one unit: the new record is
written, fsynced and atomically renamed, the directory is fsynced once, and only then
is the replaced record unlinked, so the replacement is durable before the old name is
removed on any filesystem whose directory fsync persists the operations issued before
it. The request intent is written together with the first dispatch intent in one unit
immediately before the send. A request therefore forces the directory four times.
Both intents must be durable before a provider send. A replacement is durable before
its old intent is unlinked; the unlink itself has no additional directory fsync, so
a crash may leave both names and recovery keeps the settled record. A crash before
the fused begin's directory fsync may leave either intent alone; no provider send
has occurred at that point, and surviving intents recover as UNKNOWN. PostgreSQL fsync,
synchronous_commit and full_page_writes stayed on; no SQL, lock, transaction
boundary or acknowledgement boundary changed.
The candidate was measured twice. Its first form, e6f4d43b, unlinked the replaced
record before the unit's directory fsync and passed the same rule (38.21 / 38.11 ms
against 41.66 / 41.82 ms). A review then found that this order made the replacement's
durability before the old name's removal depend on the filesystem persisting directory
operations in issue order, which ext4 and XFS do, POSIX does not promise, and the
journal volume check does not require. c8de5d86 moves the unlink after the fsync,
with the same four forces per request, and the comparison was repeated on it in full.
The tables below are that second run; the first run's data remain downloadable at the
end of this section.
The acceptance rule was fixed before the run: both candidate read-bypass p99 values below both control values. It passed: 37.05 / 37.70 ms against 41.31 / 40.22 ms. Medians fell on every gateway path. Rarer tails (p99.9, maximum) moved less, in both directions, and remain storage-sensitive, as the sections below explain.
Each path uses 60 seconds of discarded warmup and 120 seconds measured at 50
requests/second against a zero-delay local provider, ordered candidate → control →
control → candidate with fresh stores for every run. / separates independent
repetitions; these are total client response times, not pooled percentiles.
| Path | Control p50 (ms) | Candidate p50 (ms) | Control p99 (ms) | Candidate p99 (ms) |
|---|---|---|---|---|
| Direct zero-delay fixture | 1.16 / 1.27 | 1.22 / 1.19 | 1.93 / 2.11 | 1.96 / 1.94 |
| Semantic-cache miss | 46.37 / 46.21 | 42.72 / 42.43 | 58.72 / 58.21 | 53.95 / 52.77 |
| Cache read bypass | 31.57 / 31.26 | 27.95 / 28.45 | 41.31 / 40.22 | 37.05 / 37.70 |
| Exact L1 cache hit | 19.28 / 19.49 | 18.22 / 18.35 | 26.32 / 26.50 | 25.34 / 26.19 |
Read-bypass tail, stages and journal units#
| Read-bypass percentile | Control (ms) | Candidate (ms) |
|---|---|---|
| p99 | 41.31 / 40.22 | 37.05 / 37.70 |
| p99.9 | 67.52 / 65.92 | 60.73 / 70.91 |
| Maximum | 80.77 / 83.39 | 79.30 / 84.86 |
| Read-bypass stage | Control mean (ms) | Candidate mean (ms) |
|---|---|---|
identity.auth |
0.05 / 0.06 | 0.05 / 0.06 |
model.resolve |
0.05 / 0.06 | 0.06 / 0.05 |
ratelimit.reserve |
4.10 / 4.12 | 4.20 / 4.22 |
guardrail.input |
0.07 / 0.08 | 0.07 / 0.07 |
router.select |
0.46 / 0.48 | 0.48 / 0.47 |
provider.attempt |
13.58 / 13.34 | 10.92 / 11.28 |
guardrail.output |
0.04 / 0.04 | 0.04 / 0.04 |
ledger.write |
10.31 / 10.02 | 9.00 / 9.27 |
provider.attempt includes the request and dispatch intents written before the
send and the settled dispatch record written after it; ledger.write includes the
row's journal record, the settlement transaction and the record's removal. Both
stages lost directory fsyncs. Stage values are inclusive means per invocation and
are not additive.
| Journal unit on cache read bypass | Control units/request | Candidate units/request | Control mean (ms) | Candidate mean (ms) |
|---|---|---|---|---|
record |
4.01 / 4.01 | 3.00 / 3.00 | 2.85 / 2.77 | 3.41 / 3.53 |
delete |
4.00 / 4.01 | 2.00 / 2.01 | 1.33 / 1.28 | 1.33 / 1.39 |
A candidate record unit may write two files, or write one, fsync the directory and
then unlink another, which is why its mean is higher while there are fewer of them.
Unlinking after the fsync did not lengthen the unit: 3.41 / 3.53 ms here against
3.58 / 3.55 ms in the first run. One delete per request in both variants belongs to
the background replay of the dispatch record, not to the request thread. The manifest
transactions (prepare, transition, settle) were unchanged within 0.15 ms.
CPU and verification#
| Path | Control JVM CPU (ms/request) | Candidate JVM CPU (ms/request) |
|---|---|---|
| Semantic-cache miss | 62.69 / 61.98 | 62.58 / 62.52 |
| Cache read bypass | 58.52 / 58.12 | 57.52 / 58.11 |
| Exact L1 cache hit | 9.16 / 9.42 | 9.16 / 9.29 |
JVM process CPU includes background work during each measured window; it excludes PostgreSQL and other services. No CPU change is claimed.
All 96,000 measured requests completed with HTTP 200 (72,000 through the gateway, 24,000 directly to the fixture), exactly 6,000 per path in every run, with zero measured timeout, transport failure, dropped launch or outstanding request. In every run the ledger rows equal the successful gateway responses and the distinct event ids, each carries the fixture's two settled budget charges with matching amounts and evidence, every dispatch record was delivered, and journal pending, held, failure and replay-failure counts are zero. No container restart or OOM was observed; all owned run containers stopped. In the last run one semantic-miss request's index lookup window was skipped; it was served as a miss with HTTP 200 and a ledger row, and the harness's consultation gate (at least 99 percent) passed.
| Run order | Runtime | Semantic-miss headers |
|---|---|---|
| 1 | candidate c8de5d86 |
consulted=6000 |
| 2 | control 2981c99a |
consulted=6000 |
| 3 | control 2981c99a |
consulted=6000 |
| 4 | candidate c8de5d86 |
consulted=5999, skipped-window=1 |
The candidate JAR differs from the control JAR only in the usage-journal, journal
epoch store and router classes. Before the comparison, 26 targeted test classes
(270 tests: journal protocol and crash-state tests, settlement transaction
atomicity, budget restore and recovery, stream settlement and the router) passed
on the benchmark host with real PostgreSQL containers. Six new journal tests pin the
fused protocol and its crash states, the rename-fsync-unlink order, and that a dispatch
intent found without its request intent boots and replays as an UNKNOWN send.
This short comparison does not transfer any 12-hour/24-hour qualification to the
candidate.
The shipped whole-stack crash-resolution drill was run on 29 October against both
forms of the candidate, e6f4d43b and c8de5d86, and passed both times (45 checks
each, none failed) with the same recovered figures: the gateway was killed with SIGKILL
while 20 dispatched requests were unanswered, restarted on the same journal, recovered
each request's intent and its dispatch intent as UNKNOWN (20 interrupted ledger rows,
20 unresolved dispatches, 20 admitted reservations), held the budget counter at settled
plus held through the alert's 15-minute window, raised and then resolved the
unresolved-reservation alert after one accepted attestation, refused the under-floor
and stale attestations without writing, and served, charged and forwarded nothing
during the attestation race. One crash shape was exercised, not power loss, and a
process kill cannot reach the reordering state that c8de5d86 removes. The endurance
run remains to be done before release.
Download client timings and attempt counts, stage, transaction and journal-unit measurements, and JVM CPU observations of this run; the first run's client timings, stages, CPU and chart are kept.
WAL segment-size comparison#
29 October 2026: same application runtime 2981c99a in all four runs.
This comparison isolates PostgreSQL WAL segment size: 1 MiB → 16 MiB → 16 MiB →
1 MiB, with fresh stores for each repetition. Both settings retain 4 MiB WAL buffers,
eager initialization, recycling, fdatasync, fsync, synchronous commits and
full-page writes. Gateway journal, SQL, model, CPU and memory settings are identical.
The 1 MiB setting was not adopted. It did not consistently improve read-bypass p99: the acceptance rule required both candidate repetitions to be lower than both 16 MiB controls. Lower p99.9 values alone do not establish a p99 fix. The shipped PostgreSQL profile remains unchanged, and the runtime remains pending separate 12-hour/24-hour qualification.
Each path uses 60 seconds of discarded warmup and 120 seconds measured at 50
requests/second against a zero-delay local provider. / separates independent
repetitions; these are total client response times, not pooled percentiles.
| Path | 16 MiB p50 (ms) | 1 MiB p50 (ms) | 16 MiB p99 (ms) | 1 MiB p99 (ms) |
|---|---|---|---|---|
| Direct zero-delay fixture | 1.22 / 1.20 | 1.23 / 1.17 | 2.14 / 1.99 | 2.01 / 1.98 |
| Semantic-cache miss | 46.62 / 46.34 | 46.91 / 46.30 | 58.43 / 57.73 | 58.37 / 57.85 |
| Cache read bypass | 31.47 / 31.52 | 32.21 / 31.79 | 42.34 / 41.47 | 42.14 / 41.09 |
| Exact L1 cache hit | 19.55 / 19.39 | 19.54 / 19.76 | 27.25 / 26.53 | 26.77 / 26.77 |
Read-bypass tail and accounting stages#
| Read-bypass percentile | 16 MiB (ms) | 1 MiB (ms) |
|---|---|---|
| p99 | 42.34 / 41.47 | 42.14 / 41.09 |
| p99.9 | 64.42 / 69.38 | 47.55 / 47.20 |
| Maximum | 84.03 / 85.31 | 53.66 / 51.10 |
| Read-bypass stage | 16 MiB mean (ms) | 1 MiB mean (ms) |
|---|---|---|
identity.auth |
0.06 / 0.05 | 0.06 / 0.06 |
model.resolve |
0.05 / 0.05 | 0.05 / 0.06 |
ratelimit.reserve |
4.09 / 4.12 | 4.12 / 4.07 |
guardrail.input |
0.07 / 0.07 | 0.07 / 0.07 |
router.select |
0.47 / 0.48 | 0.48 / 0.47 |
provider.attempt |
13.61 / 13.62 | 13.92 / 13.76 |
guardrail.output |
0.03 / 0.04 | 0.04 / 0.03 |
ledger.write |
10.28 / 10.22 | 10.44 / 10.33 |
Stage values are inclusive means per invocation and are not additive. The complete CSV preserves all measured stages, transaction components, journal operations and histogram bounds for all four paths.
CPU and verification#
JVM process CPU includes background work during each measured window; it excludes PostgreSQL and other services and is not total deployment CPU.
| Path | 16 MiB JVM CPU (ms/request) | 1 MiB JVM CPU (ms/request) |
|---|---|---|
| Semantic-cache miss | 63.59 / 63.28 | 63.05 / 63.11 |
| Cache read bypass | 59.03 / 59.01 | 59.39 / 59.17 |
| Exact L1 cache hit | 9.53 / 9.21 | 9.33 / 9.39 |
All 96,001 measured requests completed with HTTP 200 (72,001 through the gateway, 24,000 directly to the fixture), with zero measured timeout, transport failure, dropped launch or outstanding request. The downloadable CSV reports actual attempt counts and per-run latency summaries; no response was excluded. The final semantic-miss window included one extra scheduler-boundary request (6,001); it is included under the predeclared time-window population rule. Final ledger rows match successful gateway responses, each has the fixture's two settled budget charges, charge amounts and evidence match, and journal pending/held counts are zero. No container restart or OOM was observed; all owned run containers stopped.
| Run order | WAL segment size | Semantic-miss headers |
|---|---|---|
| 1 | 1 MiB | consulted=6000 |
| 2 | 16 MiB | consulted=6000 |
| 3 | 16 MiB | consulted=6000 |
| 4 | 1 MiB | consulted=6001 |
Semantic consultation retains the ≥99% gate. No cache-error counter or cache-timeout log was observed in these short runs; the accepted long-run cache observations remain disclosed in release status.
Download client timings and attempt counts, stage and accounting component measurements, and JVM CPU observations.
Performance candidate#
28 October 2026: candidate runtime 2981c99a, compared with qualified runtime
e71e5da8 in four fresh runs ordered candidate → baseline → baseline → candidate.
Both variants used the same durable profile with the intentional worker-policy
change described below.
| Measurement setting | Value |
|---|---|
| Arrival rate | 50 requests/second |
| Warmup | 60 seconds discarded per path |
| Measurement | 120 seconds / 6,000 requests per path |
| Repetitions | Two fresh runs per variant |
| Request shape | Short, nonstreaming prompts; zero-delay local provider fixture |
Values separated by / show independent repetitions, not pooled percentiles or
confidence intervals. These are total client-observed response times.
Client response times#
| Path | Baseline p50 (ms) | Candidate p50 (ms) | Baseline p99 (ms) | Candidate p99 (ms) |
|---|---|---|---|---|
| Direct zero-delay fixture | 1.27 / 1.24 | 1.21 / 1.24 | 2.06 / 2.12 | 2.07 / 1.99 |
| Semantic-cache miss | 50.88 / 51.68 | 46.69 / 46.78 | 63.36 / 64.45 | 57.79 / 59.62 |
| Cache read bypass | 33.31 / 33.89 | 31.63 / 31.90 | 43.97 / 46.11 | 41.38 / 51.58 |
| Exact L1 cache hit | 20.59 / 21.05 | 20.43 / 19.63 | 28.34 / 29.57 | 28.54 / 28.61 |
Read the result by path:
- Semantic miss: both candidate medians and p99s were lower than both baseline repetitions.
- Read bypass: both medians improved, but the second candidate p99 rose to 51.58 ms, above both baselines. The comparison does not establish a consistent tail-latency improvement for this path.
- Exact hit: medians improved modestly; the p99 ranges overlap.
Stage breakdown#
The instrumented semantic-miss stages changed as follows. These are means per invocation, with inclusive boundaries; do not add them to reconstruct a response or treat a provider-attempt span as pure model inference.
| Semantic-miss stage | Baseline mean (ms) | Candidate mean (ms) |
|---|---|---|
identity.auth |
0.08 / 0.08 | 0.08 / 0.08 |
model.resolve |
0.08 / 0.08 | 0.08 / 0.08 |
ratelimit.reserve |
4.37 / 4.44 | 4.12 / 4.16 |
guardrail.input |
0.08 / 0.08 | 0.08 / 0.08 |
cache.lookup |
17.54 / 17.67 | 14.32 / 14.25 |
router.select |
0.50 / 0.50 | 0.51 / 0.50 |
provider.attempt |
14.12 / 14.41 | 13.96 / 14.07 |
guardrail.output |
0.04 / 0.04 | 0.04 / 0.04 |
ledger.write |
10.88 / 11.16 | 10.23 / 10.37 |
CPU cost#
The worker policy can trade more active CPU for lower latency. The following is
JVM process CPU time per completed request, including background work during
each measured window; it is not wall time or total deployment CPU. The gateway
retains the same 8-CPU allowance. The read-bypass requests use no-cache, so eligible
asynchronous stores and their embedding work still run. no-store is a different
path and was not measured here. The direct-fixture window's idle/background JVM
CPU is retained in the downloadable CPU CSV.
| Measured path | Baseline JVM CPU (ms/request) | Candidate JVM CPU (ms/request) |
|---|---|---|
| Semantic-cache miss | 66.42 / 66.94 | 63.57 / 63.10 |
| Cache read bypass | 65.44 / 65.92 | 58.82 / 59.30 |
| Exact L1 cache hit | 10.20 / 10.23 | 9.61 / 9.42 |
Durable accounting components#
Manifest transactions and journal I/O explain some of the remaining accounting cost:
| Manifest transaction on semantic misses | Baseline mean (ms) | Candidate mean (ms) |
|---|---|---|
prepare |
1.84 / 1.87 | 1.54 / 1.57 |
transition |
1.53 / 1.56 | 1.57 / 1.58 |
settle |
5.19 / 5.33 | 4.55 / 4.60 |
| Journal operation on semantic misses | Baseline mean per operation (ms) | Candidate mean per operation (ms) |
|---|---|---|
record |
2.84 / 2.91 | 2.83 / 2.88 |
delete |
1.31 / 1.36 | 1.31 / 1.34 |
A record operation includes writing, file fsync, atomic rename and directory fsync. A delete operation includes unlink and directory fsync. A request can perform several operations; these per-operation means are nested observations, not extra stages to sum with the table above. In this runtime a request that reaches a provider performs four record and three delete operations on its own thread; the journal unit fusion candidate performs three and one. The downloadable CSV retains their counts and journal-admission/I/O-wait observations.
Cache execution and accounting durability#
- Cache lookup: size ONNX workers to half the JVM container CPU count (one to four workers), permit spinning during active inference, and park workers when the last concurrent inference returns. In this 8-CPU rig the candidate has four intra-op workers; the baseline uses automatic ONNX sizing with fully blocking workers. These are intentional worker-policy changes alongside the runtime update. Model weights, tokenizer, input window, pooling, normalization, similarity thresholds, lexical verification, scopes and replay checks are unchanged. This does not change the 50 ms Redis timeout or establish that earlier long-run cache timeouts are resolved.
- Durable accounting: batch reservation transitions and settlement writes;
verify charge amounts in one query; remove an unused prepare read. Reservation
locks, the budget-trust lock, conflict checks and the single ledger/charge/state
transaction remain. Replay retains the original evidence and operation identity.
No file fsync, directory fsync, atomic rename, durable deletion ordering or
acknowledgement boundary was removed. PostgreSQL
fsync,synchronous_commitandfull_page_writeswere allonin both variants.
The candidate JAR differs in four entries: the embedding adapter, its configuration
wiring, shipped application settings and reservation-manifest class. Packaged
libraries, model/tokenizer artifacts and journal classes are byte-identical. The
candidate image is b0c1d3a43ab3; the baseline image is a294897dcb30.
Verification and remaining scope#
All 96,000 measured requests completed with HTTP 200: 72,000 through the gateway and 24,000 directly to the fixture. Each path passed its cache-header checks, with zero measured timeouts, transport failures, dropped launches or outstanding requests. Semantic consultation retains the original ≥99% gate; conservative window-check bypasses are disclosed rather than counted as semantic lookups:
| Run | Semantic-miss headers |
|---|---|
| candidate 1 | consulted=6000 |
| baseline 2 | consulted=6000 |
| baseline 3 | consulted=6000 |
| candidate 4 | consulted=5999, skipped-window=1 |
Final captures matched successful gateway responses to unique ledger rows, matched charges to settled reservations, found no charge/amount/evidence mismatch or unresolved settlement, and verified journal drain. All owned containers stopped with no observed restart or OOM. No cache error counter or cache-timeout log was observed in these short runs; the longer-run observations remain disclosed in release status.
183 distinct targeted Java tests passed with no skips, plus six offline analysis tests, including real PostgreSQL
JPA/JDBC rollback and replay, conflicting charges, missing siblings, journal
failure/recovery bounds and cache checks. Real MiniLM vectors matched the upstream
implementation at the existing 1e-6 component tolerance across empty, Unicode,
short, mixed-batch and window-boundary inputs, including overlapping calls and parked-worker reuse.
Qualification boundary: this performance candidate has not repeated the 12-hour/24-hour qualification. The accepted release evidence belongs to
e71e5da8.
The short named-model comparison does not establish:
- Adaptive-routing performance or superiority.
- Long-prompt or streaming performance.
- Maximum production capacity or a production latency SLO.
- Semantic-hit answer quality.
Durable filesystem and database work still contributes to latency. The response acknowledgement retains its existing durability boundary.
Download the per-run client timings and attempt counts, stage/component timings with counts and histogram bounds, and CPU observations.
Storage-sensitive tail latency#
Cache read bypass skips cache lookup, but still performs rate-limit admission,
provider dispatch and durable accounting. X-Cache-Control: no-cache also permits
eligible background cache stores; no-store disables both cache reads and writes.
Neither directive disables accounting or changes the response acknowledgement
boundary.
A separate instrumented diagnostic on runtime 2981c99a measured 6,000 requests
on each of three paths. All 18,000 completed with HTTP 200 and reconciled exactly.
| Diagnostic path | p50 (ms) | p99 (ms) | p99.9 (ms) |
|---|---|---|---|
| Read bypass, first window | 33.02 | 44.26 | 58.34 |
Read and write bypass (no-store) |
32.40 | 44.42 | 71.49 |
| Read bypass, second window | 31.74 | 41.70 | 69.89 |
PostgreSQL commit waits coincided with repeated response-time spikes even with
no-store. Twenty commit-stall clusters began within 2.6 ms of new 16 MiB WAL-file
creation. No measured virtual-thread pinning or long GC pause explained those
clusters. These are temporal correlations from a JFR-instrumented diagnosis, not
per-request causal traces or a reproduction of every earlier outlier.
The commit-stall clusters account for the responses above 50 ms, roughly 0.3% of requests, and not for the p99 itself: both storage experiments below moved p99.9 and the maximum and left p99 in place. The same diagnostic recorded about nine journal fsyncs of a millisecond or more per read-bypass request, which the journal unit fusion comparison addressed.
PostgreSQL creates and flushes WAL segments before using them. Eager initialization can produce a foreground I/O burst until enough files can be recycled. Disabling zero-fill still requires a flush and can shift allocation work into ordinary writes; it did not consistently improve p99 on this test rig. All runs retained database flush, synchronous-commit and full-page-write protections and the gateway journal barriers.
Changing segment size is a separate storage-profile choice: PostgreSQL fixes it when a cluster is initialized. Existing databases do not change segment size when an initialization environment variable changes. Smaller segments also increase rotation frequency and file count; archival and replication workloads require their own validation. See PostgreSQL WAL configuration and cluster initialization.
Benchmark environment#
- One gateway container per run, Java 21 with generational ZGC, 256–640 MiB heap
and a 2.5 GiB container limit. The application comparison uses qualified baseline
image
a294897dcb30and candidateb0c1d3a43ab3; the storage comparison usesb0c1d3a43ab3in every run. - PostgreSQL 16.15 on an ext4 filesystem backed by a nonrotational virtual disk. WAL buffers are 4 MiB; the storage comparison explicitly records 1 or 16 MiB segments. These results do not characterize every storage device or topology.
- Shared 16-vCPU Linux KVM host. Gateway affinity: eight vCPUs; load generator: three; stores, provider fixture and learner: four. Runs are sequential and use fresh stores, with no unrelated containers active during the comparison.
- Durable journal, enforced counter/cache-store checks, reservation manifests and transaction-first settlement enabled; intake limit 32. Authentication and local guardrails enabled. INFO logging; tracing export disabled.
- Local MiniLM and Redis semantic cache enabled with identical model, tokenizer
and native-library artifacts. The intentional worker-policy difference is
documented above. Tokenizer accounting uses
cl100k_base. - Short synthetic user prompts:
soakplus ten pseudorandom vocabulary items,temperature: 0, nonstreaming, no tools/images, one named model and one provider deployment. Exact hits use a prepopulated set of 20 prompts. - Internal Docker HTTP network with no external connectivity. WireMock injects zero provider delay. No real-provider, external guardrail, judge or optional adaptive-routing call is part of the measured request.
What each section does#
The request lifecycle explains ordering and failure handling. These timer names let an operator connect a latency observation to that design.
| Section | Timer | Included work and boundaries |
|---|---|---|
| Authentication | identity.auth |
Parse/validate the virtual key and resolve its identity. Warm identity caches are part of this workload; this is not a cold database-lookup benchmark. The timer closes before downstream processing. |
| Model authorization and resolution | model.resolve |
Allowed-model composition, model/capability resolution and counted context requirements. It does not separately isolate tokenization or every scope-path operation. |
| Rate limits and budgets | ratelimit.reserve |
Match applicable rules and reserve their counters. Durable reservation-manifest work may sit inside this span. Per-provider budget checks and final reconciliation also occur elsewhere. |
| Input guardrails | guardrail.input |
Run the enabled local input chain. The defaults include message bounds, secret detection and a prompt-injection heuristic. Empty blocked-pattern lists do not simulate a large custom regex ruleset. |
| Cache lookup | cache.lookup |
Exact L1 lookup, and eligible semantic L2 work: native window checks/embedding, vector lookup and hit verification. Cache bypass skips this timer. An L1 hit does not pay the semantic embedding path. |
| Routing | router.select |
Filter and choose among eligible deployments. A single named-model deployment does not measure a large candidate set or adaptive strategy cost. |
| Provider attempt | provider.attempt |
Includes attempt budget/accounting work, request translation, HTTP exchange, response decoding and attempt settlement. It is not a pure provider-inference timer, even when the fixture injects no delay. |
| Output guardrails | guardrail.output |
Apply enabled complete-response checks. External moderation, webhook and ML guardrails have their own latency and are not exercised here. |
| Usage recording and settlement | ledger.write |
In the durable profile, the call includes journal append and applicable synchronous settlement delivery. It is not just an asynchronous enqueue. Other journal intent/dispatch operations occur outside this timer. |
gateway.cache.l2.op and pointsman.budget.manifest provide additional component timers. L2 lookup timing can include embedding; it is not a Redis-only network measurement. Asynchronous cache storage is background work and must not be added to the foreground response latency. Manifest timers are nested within broader operations.
Policy authorization and the policy service#
The scope/grant authorization core is enabled by default, while request-path tree composition is disabled by default. This benchmark keeps those defaults. It measures virtual-key authentication and the fixed request allow-set path; it does not assign a millisecond cost to administrative grant changes, deep scope inheritance or opt-in tree composition.
The Python policy service is a learner, separate from authorization. Normal adaptive selection uses a gateway-local parameter snapshot; reward delivery and parameter refresh happen in the background. This named-model test does not exercise adaptive choices and does not establish an adaptive-routing latency number. Optional external judges, cascades and context processing need separate measurements.
Read the stage numbers correctly#
| Signal | Calculation | Interpretation |
|---|---|---|
| Stage mean | Change in accumulated duration ÷ change in call count | Mean duration of the instrumented operation |
| Stage percentile | Estimate from changes in Prometheus histogram buckets | Bucket-resolution estimate; very small operations can share the first bucket |
| Component with only sum/count | Mean only; percentile CSV fields remain blank | Percentiles are unavailable, not zero |
| Client percentile | Distribution of complete client-observed responses | Includes work outside the named stage timers |
The boundary scrapes bracket the client measurement and the harness's own metric reads. Their populations can differ slightly from the client-window population because requests cross those boundaries. Raw counts are retained; the tables do not claim exact per-request tracing.
When comparing results:
- Keep stage p50s and p99s separate: they describe different observations, and some timers nest.
- Allow for uninstrumented work, HTTP encoding/decoding, scheduling, socket transfers and response delivery. A residual from unrelated percentiles cannot identify “network time.”
- Use total response latency for cache hits. A hit avoids the provider call, so subtracting a direct-provider distribution does not measure forwarding overhead.
Scope and limitations#
This is a short, single-instance, warm, fixed-arrival-rate benchmark with a local zero-delay fixture and short synthetic prompts. It is separate from the accepted 12-hour and 24-hour reliability runs. Their latency distributions include simulated provider delay, long prompts, streaming, deliberate cancellations and slow readers; they must not be presented as gateway overhead.
| Factor | Why your deployment may differ |
|---|---|
| Infrastructure | Shared vCPUs and co-located stores, provider fixture and generator affect scheduling. CPU affinity does not guarantee dedicated physical cores. |
| Workload | Prompt size, corpus, connection reuse and cache occupancy change the work per request. |
| Controls | Logging, durable accounting, JVM/native allocations and enabled optional stages affect cost. |
| Network and providers | Internet/TLS ingress and real-provider generation are outside this local-fixture measurement. |
These measurements do not establish a production p99 SLO, maximum capacity, real semantic-hit quality or a comparison with another gateway.
Reproduce and measure your deployment#
Use the repository's standalone load-test/OverheadScenario on disposable, isolated stores and a fake provider.
- Start an isolated rig. The harness targets an already running environment; it does not provision isolation for an arbitrary target.
- Record runtime/image identity, effective configuration, CPU/memory limits, native model/library hashes and corpus.
- Set endpoint and output variables explicitly, using a fresh output directory for each repetition.
- Run direct, miss, read-bypass and hit paths with the same client/load shape. Separate warmup from measurement.
- Retain every attempt outcome, cache header and start/end metric. Report timeouts, transport failures and dropped launches beside percentiles.
- Drain pending work, then verify final accounting and resource cleanup.
Harness configuration#
| Variables | Purpose |
|---|---|
RPS, WARMUP_SEC, MEASURE_MIN |
Offered rate and warmup/measurement durations |
GATEWAY_A, WIREMOCK_URL, PG_URL |
Disposable gateway, provider fixture and database endpoints; the provider must be reachable from both generator and gateway |
RESULTS_DIR, BENCHMARKS_MD |
Fresh result destinations |
BENCH_TOKEN_ENCODING=cl100k_base |
Explicit model encoding; leaving it unset omits the encoding declaration |
RAW_METRICS_DIR |
Immutable before/after Prometheus snapshots for each path |
Report an absent stage as “not exercised” or “unavailable.” To measure an optional feature, change only that feature in a matched comparison and inspect both client distributions and stage timers. A difference in p99s remains a distribution difference, not a per-request overhead percentile.